Rethinking shots: generation and conversion
(30 Jan 2019) The source code for this model is available on https://github.com/huffyhenry/shot-generation.
Football analytics today is dominated by analysis of shots, but only at the level of conversion. Relatively little attention has been paid to how shots arise, despite it being arguably the more important question. I call this process shot generation and its analysis is the main contribution of this post, although I also present a simple conversion model for completeness and symmetry. My motivation, as always, is to try to understand the underlying dynamics of football without compromising on statistical rigour.
In the early days of (public) analytics, Sander IJtsma and Ben Pugsley investigated how the in-game goal difference (dubbed “game state”) impacts shot ratios. To the best of my knowledge, the first actual model of shooting frequencies is due to Garry Gelade and it was the highlight of the 2015 OptaPro Forum. The new model that I present here is related to Garry’s and it recovers many of his results, but it also yields findings that I believe are novel. Specifically, I was able to show that the home field advantage is mediated by the quantity rather than the quality of shots, that shooting rates differ between not just game states but individual scorelines and that the longer the game goes on without a shot, the more likely the players are to shoot. In addition, the framework presented here has direct applications to performance evaluation and prediction of results, which I hope to discuss in follow-up articles.
Models
My generation model draws heavily on the classic Dixon-Coles and
(especially) Dixon-RobertsonRobinson papers and uses techniques of survival analysis (for a
relatively gentle introduction see Chapter 1 of J.F. Lawless’
“Statistical Models and Methods for Lifetime Data”, which at the time
of writing is easily obtainable in PDF form, as are the two
papers). Briefly, I assume that every team is characterised by
parameters $\alpha$ and $\beta$, representing its baseline ability to
generate and prevent shots, respectively. Then, if team A plays team B
and $w$ minutes have elapsed since either of them last shot (or the
start of the half), then the propensity $\lambda_A$ of team A taking
the next shot right now is given by
In addition to the parameters already explained above, $\gamma$ is the home advantage parameter (if appropriate, i.e. if A is the home team) and $\theta$ is the sum of additional coefficients which I don’t enumerate in full here, but which include in particular dummy variables for each individual score from 0:0 to 2:2. Lastly, $k$ controls the dependence of the rate of shooting on the time elapsed since the last shot. If $k=1$, there is no such dependence, since $w$ disappears from the equation.
As to conversion, it is possible to just use an expected goals model here, but they are data hungry and unnecessarily complex for the task at hand. Instead, I ran a simple logistic regression of the form
\[\textit{goal} \sim \textrm{Bernoulli}(\textrm{Logit}^{-1}(\alpha_A + \beta_B + \gamma + \theta))\]with $\alpha_A$ this time standing for the shooting team’s intrinsic ability to convert their shots and $\beta_B$ for the defending team’s ability to prevent shots from going in, respectively.
I fitted both models on the dataset of all shots from the 2017/18 Premier League. This is a considerably smaller set than what I have available, but I didn’t want to concern myself with inter-league differences in styles nor with inter-season variation of team strengths; as a friend of mine is fond of saying, it requires multilevel modelling and a lot of care, and who has the time for that? I stripped rebounds (defined as shots coming within 5 seconds of previous shot), because they are not generated independently of other shots – I’m going to deal with them at a later stage. This process left me with 9439 records. I coded and fitted my models in Stan.
Results
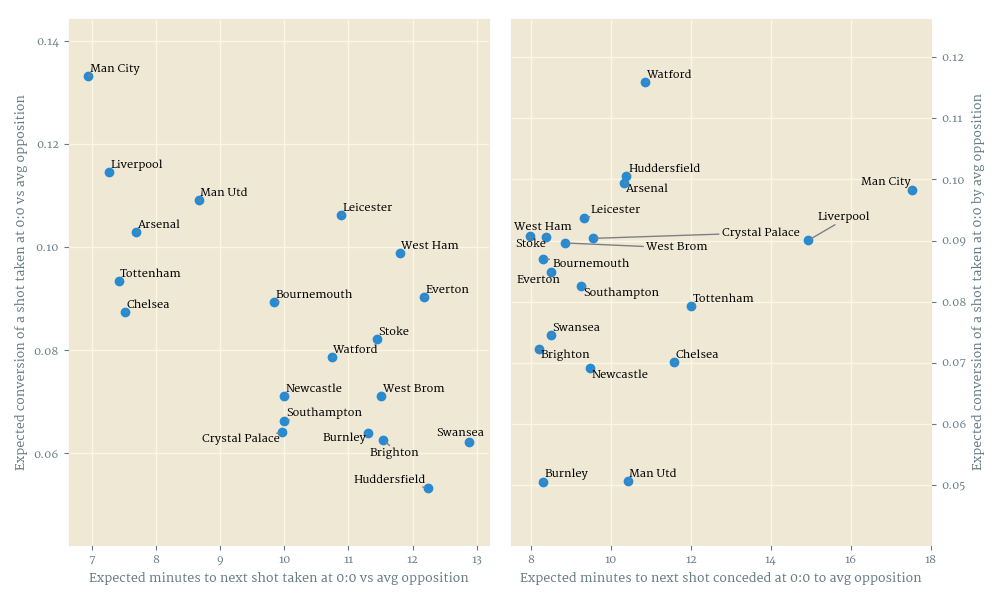
The scatter plots on Figure 1 below show the fitted team profiles, that is to say the $\alpha$ and $\beta$ coefficients from both models, translated into shot waiting times and expected conversions for interpretability. What stands out to me is how Manchester City were a class apart on both sides of the ball, and how terrible Arsenal’s defence was – on par with Huddersfield’s. The conversion model recovers neatly Burnley’s and Mourinho+DeGea’s ability to prevent the ball from going in.
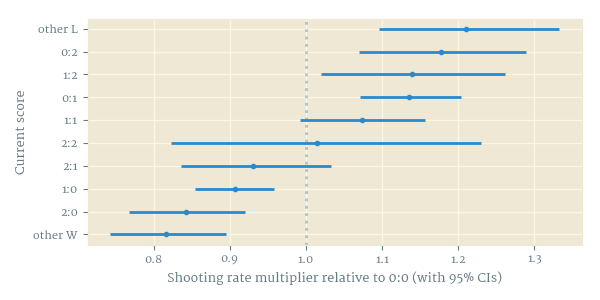
Of greater interest, however, are the estimates of the remaining, team-independent parameters. The current score has a large effect on the shooting rate, and while the different exact winning (and drawing, and losing) scores are not statistically different from each other, the sorting is so perfect that I have no doubt that the estimates would separate with a bigger sample (Figure 2); in contrast, there was no discernible effect of scores on conversion probability (not shown). The home advantage parameter $\gamma$ is positive in the generation model, but zero or even very slightly negative in the conversion model. Lastly, in the generation model, the exponent $k$ fitted tightly to about 1.16 meaning that the longer the teams go without shooting, the more likely they become to take a shot, while the corresponding parameter in the conversion model was slightly negative, although not statistically different from zero.
Conclusions
By modeling shot generation and shot conversion with separate but parallel models, we learnt the following:
- Current score has a large effect on shooting rate but very small or no effect on conversion probability
- Home field advantage is realised by the quantity and not quality of shots
- The longer the game goes on without a shot, the more likely the teams are to shoot, and the worse shots they take
I hope that these results, if not all of them entirely novel, are going to spark renewed interest in foundational modelling of football.
My friends James Yorke, Ben Torvaney, Nikos Overheul and Thom Lawrence commented on preliminary results, read an earlier version of the article and provided useful, largely ignored feedback. The data used in this analysis was collected by Opta.